University of Liverpool to mark #ShowYourStripes day
Published on

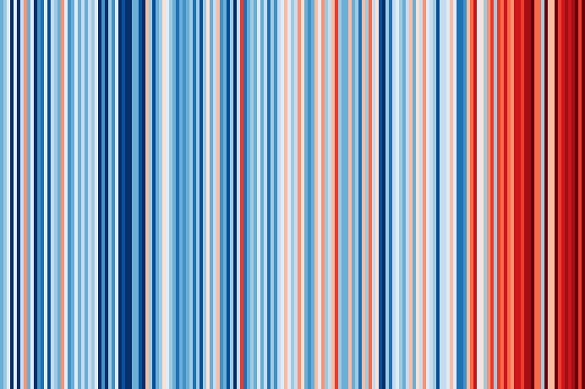
The University of Liverpool will display an image of the Liverpool region’s ‘Warming Stripes’ in the Museum of Liverpool to mark #ShowYourStripes day which takes place on Wednesday, 21 June.
Now in its fifth year, #ShowYourStripes day aims to raise awareness of the rising global temperatures.
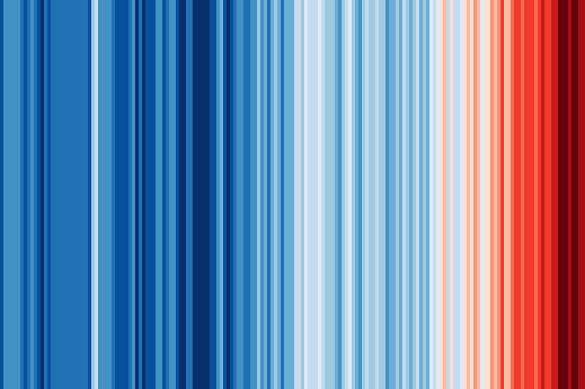
The Warming Stripes, developed by Professor Ed Hawkins at University of Reading, use bands of colour to provide a simple visual representation of the increasing annual temperatures as measured all over the globe.
Each stripe represents the average temperature over a period of one year, and the colours correspond to the average annual temperatures, with blue shades representing cool temperatures and red representing hotter years.
In virtually every country, region, or city worldwide, the Warming Stripes transition from predominantly blue to predominantly red over time, illustrating the increase in average temperatures recorded in each specific location.
The data show clear evidence that the hottest years worldwide have taken place in the past twenty years and we are in the midst of a global climate crisis.
Professor Ric Williams from the School of Environmental Sciences and co-lead of the University's Climate Futures research theme, said: “Warming stripes are clear indicators of the warming on the planet. The only way to reduce the continued warming is to move away from our dependency on fossil fuels and decrease our collective carbon emissions. This transition is a real societal challenge, but is needed if we are to avoid every decade breaking new temperature records and being warmer than the previous one.”
The clearest warming signals are when averaged over the globe (see image below). There is always more variability at individual locations, such as Liverpool, where there are cooler records from the 1850s together with sporadic warmer events with higher temperature spikes.
These anomalies correspond with various data points in research published by the University of Liverpool's Environmental Historian, Professor Georgina Endfield. The most notable temperature spike can be seen in 1921. A record held in the Northamptonshire Record Office describes the ‘Great Drought’ where Britain endured an unprecedented long succession of dry and hot days where there was virtually no rain between January and June.
These higher temperature spikes changed from being intermittent to becoming regular occurrences year on year over the last two decades, highlighting the need for urgent action to tackle the global climate crisis.
Since their introduction in 2018, Warming Stripes have gained worldwide attention with a range of creative ways that people are showing their stripes and sharing the important message about climate change.
The University of Liverpool’s Warming Stripes display will be shown in the atrium of the Museum of Liverpool throughout Wednesday 21st June.
You can see how others are finding creative ways to showcase their warming stripes by following the hashtag #ShowYourStripes on social media.

Image credit: Professor Ed Hawkins (University of Reading).